
ote: If you would prefer the audio version of Investing Insights click here to listen to our podcast Episode 12: Stock Valuations Are Sky High – What Comes Next?
The markets during the last month and a half of the first quarter were vicious. By vicious, I mean the S&P 500 set the unwelcome record of posting the fastest -30% drop in the history of the index. The S&P 500 went from the index record highs to a loss of 30% in just 22 trading days! In contrast, it took the S&P 500, 250 trading days to lose -30% during the Financial Crisis of 2008-2009.
I am sure the losses at the end of February and through March captured your attention. It has been my experience that during long bull markets investors are not terribly interested in talking about risk as their focus is on capturing the highest returns possible and save risk management as a consideration for another day. Given the recency of the latest market crash, now is the perfect opportunity to discuss managing investment risk and particularly the shortfalls of conventional diversification, which happens to be the only line of defense most investors implement to defend against bear markets and stock market crashes. Understanding conventional diversification is very important because historically it fails when your portfolio needs it most. History repeated itself at the end of last quarter when conventional diversification failed again.
Investors too often believe large losses in the U.S. stock market are rare, the truth is they are not. In this Investing Insight I am going to share how common large losses like those we recently experienced are and why conventional diversification does not adequately protect portfolios from bear markets and market crashes. Next quarter, I will share risk management techniques that can help protect your portfolio when conventional diversification fails.
Going forward, it is possible the U.S. stock market will return to the lows of March, in fact history would indicate it is highly probable the market could move beyond the lows we have seen thus far. Given the current economic situation and the likelihood of more down markets to come, it has rarely been more important to implement robust risk management than it is today.
Large Losses Are Not Rare
Losses of -30% or more in the U.S. stock market are not terribly rare occurrences. Below is a chart that summarizes the frequency of significant U.S. stock market losses as represented by the S&P 500 index.
Frequency of Large
S&P 500 Losses Since 1928
Data as of 3/31/2020

Misconceptions among investors regarding how frequently large losses occur in the U.S. stock market are probably attributable to the often-long stretches between large losses. The longest stretch between losses greater that -30% is 27 years going back to 1928. However, the average frequency of such large losses is 6.5 years, which presents a significant risk to all investors no-matter the investing time horizon.
The frequency of large losses presents timing risk that must be managed by investors with risky portfolios, those approaching or in retirement and for organizations that regularly draw on investment gains to fund their work. A loss of -30% or more is devastating to the long-term returns of any portfolio and are large enough to permanently reduce the total returns a portfolio generates over the long-term.
Conventional diversification is the ubiquitous risk management solution and usually the only risk management solution employed by the investment management industry to protect portfolios against large losses when they occur. Conventional diversification is a useful risk management tool, however its tendency to fail when it is needed most is rarely understood or acknowledged within the investment management industry. Let us now explore conventional diversification, how it works and why it frequently fails at the time of greatest need.
What Is Conventional Diversification?
U.S. stocks are generally the highest returning assets in a portfolio and therefore often make up the largest percentage of an investment portfolio. The problem U.S. stocks present investors is that while historically they generate high returns, they are also very risky and are usually the primary contributor to portfolio losses. Many investors are not comfortable losing 30%, 50% or more of their total assets during market downturns, therefore some level of risk management is required to prevent this level of loss.
Conventional diversification seeks to mitigate the risk of U.S. stock ownership by investing in other asset classes including foreign stocks, U.S. and international bonds, commodities, real estate and many others. The investment theory behind this risk management technique is that historically the value of different asset classes rarely move in perfect tandem with the value of U.S. stocks, in some cases, the value of other asset classes move in the opposite direction to the value of U.S. stocks.
The varying degrees of independence in the value of different asset classes helps to reduce the risk of loss because when U.S. stocks are suffering large losses it becomes likely that other asset classes are losing less or possibly even generating positive returns. In either case, the size of the total portfolio loss is reduced through conventional diversification because the portion of the portfolio not invested in U.S. stocks is likely to be generating either lower losses or offsetting U.S. stock losses through positive returns. Conventional diversification is the investing equivalent to the old saying, “don’t put all your eggs in one basket”.
How Conventionally Diversified Portfolios Are Designed
While I prefer to explain investment concepts with as little mathematical detail as possible, stay with me for an explanation of a statistical measure that is key to understanding how conventional diversification works in practice and why the risk management technique fails when you need it most.
Conventional diversification relies on a statistical measure called correlation to calculate the decrease in the risk of losses from adding additional asset classes to a portfolio. Correlation mathematically measures the degree to which two asset classes change in value relative to each other. A negative correlation between two asset classes indicates that their changes in value historically move in the opposite direction of one another, meaning when one asset class is going up in value the other is usually simultaneously going down. A positive correlation between two asset classes means that their values change in lockstep with one another and in the same direction.
Asset classes with a negative correlation to one another add the most diversification benefit to a portfolio and have the greatest impact on lowering a portfolio’s risk of loss. On the other hand, asset classes with a positive correlation between one another add little to no diversification benefit and do the least in reducing the risk of loss. The degree to which the value of two asset classes move relative to one another is measured by calculating what is called a correlation coefficient, represented by a number between -1 and +1. For example, a correlation coefficient between two asset classes of -1 represents perfect negative correlation and the values of the two asset classes move in the opposite direction to one another. Conversely, a correlation of +1 represents perfect correlation and the values of the two asset classes move in lockstep with one another in the same direction.
Finally, any value in between -1 and +1 simply represents the strength of the relationship between to two asset classes, so the closer to zero from any direction the weaker the positive or negative relationship between the two asset classes will likely be. The lower the correlation coefficient is between two asset classes, the lower the risk of losses will be for a conventionally diversified portfolio.
Why Conventional Diversification Fails When You Need It Most
The time has come to present you with the bad news. Conventional diversification is not the risk management panacea that the investment management industry would have you believe. Unfortunately, during periods the U.S. stock market is suffering its worst losses, conventional diversification does little to protect a portfolio from capturing larger than expected losses. It gets worse, when U.S. stocks are experiencing their largest gains, conventional diversification works against portfolios by limiting the gains captured.
To summarize, diversification tends to fail when you need it most and drags down your gains when you need it least. During periods of abnormal performance in the U.S. stock market defined by periods when the market is experiencing historically significant losses or gains, conventional diversification works against portfolios in both directions…that is bad and widely unrecognized by the investment management industry and investors alike.
Conventional diversification fails during extreme market events because the normal relationship in how the values of each asset class move relative to U.S. stocks breaks. When the U.S. stock market is generating abnormally large losses, the correlation of U.S. stocks to other asset classes increases, and sometimes dramatically. Recalling what we learned previously about correlation, when the correlation between asset classes goes up towards +1, the risk reduction of conventional diversification decreases. During normal markets asset classes that usually do not move strongly in the same direction as U.S. stocks (low correlation) or move in the opposite direction (negative correlation) suddenly begin to move in near lockstep and in the same direction as U.S. stocks.
When the U.S. stock market is generating historically extreme losses and the correlation of all the asset classes relative to U.S. stocks simultaneously rise, the portfolio begins to generate higher than expected losses. This happens because all asset classes within a portfolio begin moving strongly in the same direction as U.S. stocks, which during extreme losses happens to be down. The bottom line is that in abnormal markets, conventional diversification fails to reduce portfolio losses and instead increases losses beyond what an investor would expect.
Unfortunately, conventional diversification also hurts portfolios by becoming too effective when it is needed the least. When the U.S. stock market is experiencing abnormally high returns, the correlation of asset classes relative to U.S. stocks declines. During normal markets asset classes that usually move more strongly in the same direction as U.S. stocks begin to move in a less coordinated fashion and sometime in the opposite direction. When U.S. stocks are moving strongly up, asset classes that simultaneously become less correlated with U.S. stocks generate lower or negative returns compared to U.S. stocks, therefore dragging down portfolio returns.
The Difference Between Theory and Practice
Why is conventional diversification usually the only risk management technique used in the design of investment portfolios if it fails when you need it most? As is common with any complex subject, there is often a difference between the academic theory behind a process and the effectiveness of the theory in practice within the real world. In theory, conventional diversification is great, in practice it has limitations.
The failure of the investment management industry to identify or acknowledge the limitations of conventional diversification comes from the blind following of investment theory during the process of designing investment portfolios. Investment managers usually choose how they will diversify asset classes in a portfolio by looking at the correlations of assets classes to each other over the long-term using full sample data. Full sample data means using historical asset class data going as far back in time as is available to calculate how asset classes historically correlate to one another.
Large sample sizes smooth out the correlations between asset classes and minimize the impact that short, infrequent market crashes or recessions have on the relationship between how asset class values historically change relative to one another. This statistical bias is analogous to calculating the simple average of hundreds or even thousands of similar numbers. The more numbers you average the less of an impact outlier numbers that are unusually small or large compared to the majority the data set will have on the result.
Failing to capture the full impact of relatively infrequent abnormal market behavior in the calculation of correlations between asset classes causes investment managers to underestimate the size of likely losses a portfolio may generate and the quality of the overall diversification. Over long periods of time there are short periods where correlations between asset classes can dramatically diverge from the long-term average. It is during these short periods where portfolios experience the greatest losses that are capable of permanently reducing the long-term total returns a portfolio is likely to generate.
During the first quarter of 2020, conventional diversification failed once again. Many investors may have been surprised how much their diversified portfolios fell during the rapid decline markets experienced. We can look simply at the asset class returns during this period and see that all major asset classes experienced losses, including traditional safe havens like gold and bonds.
Asset Class Returns
2/19/2020 – 3/23/2020
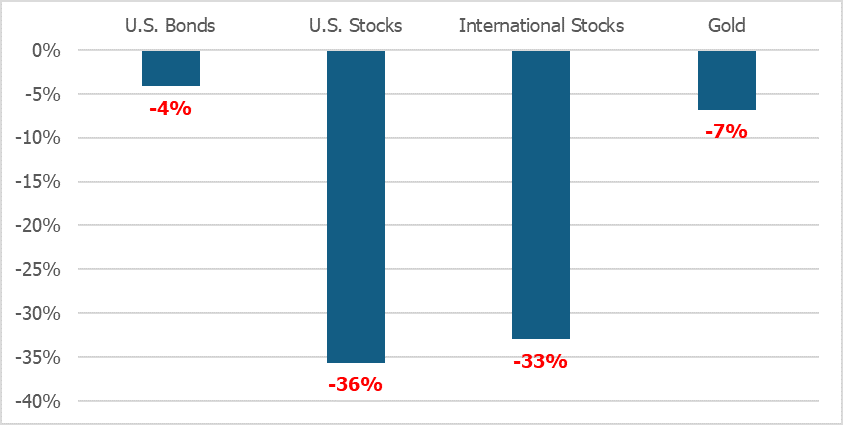
Source: Morningstar Direct
Conventional diversification assumes the correlation between U.S. stocks and other asset classes will always remain close to their full sample correlations. However, during periods of abnormal gains and losses, correlations often change rapidly from their full sample expectations. The chart below shows how asset class correlations relative to U.S. stocks change during the worst 1% stock market losses.
Correlation Changes During the Worst U.S. Stock Market Losses
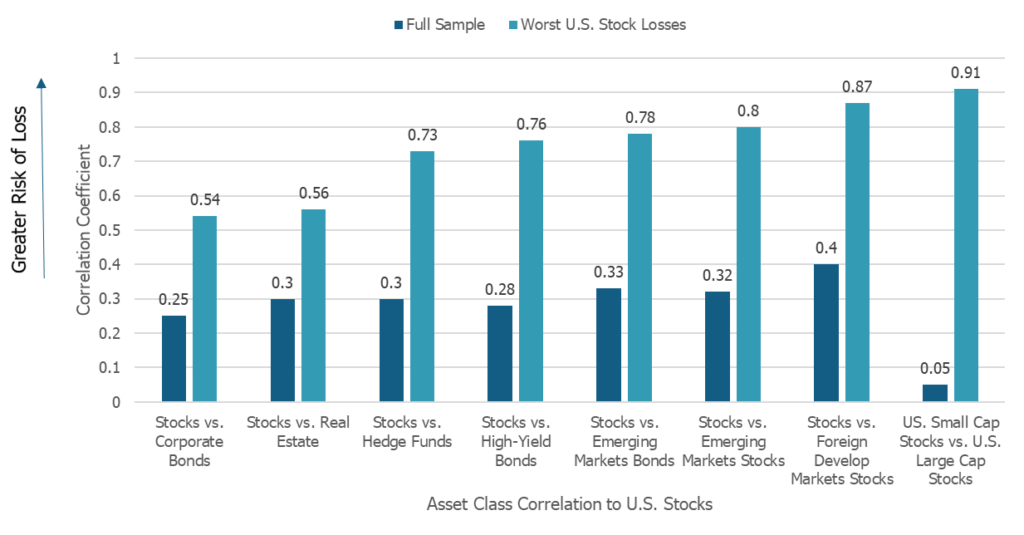
Data Source: Sebastein Page and Robert A. Panariello (2018). When Diversification Fails. Retrieved from https://www.tandfonline.com/doi/suppl/10.2469/faj.v74.n3.3/suppl_file/ufaj_a_12043535_sm0001.pdf
The dark blue bars are the full sample correlations of each asset class relative to U.S. stocks. Full sample represents the correlation that portfolio managers expect asset classes to maintain to one another when estimating the potential losses, a portfolio may generate. The higher or closer to 1 the correlation is between each asset class and U.S. stocks, the greater the loss is likely to be. The light blue bars show the change in correlation between asset classes during periods of the largest U.S. losses. We can see a dramatic increase in correlations and therefore downside risk during extreme markets, which is likely to result in larger than expected portfolio losses.
Now we can look at how conventional diversification can also drag on portfolio returns during the strongest stock rallies.
Correlation Changes During the Best U.S. Stock Market Rallies
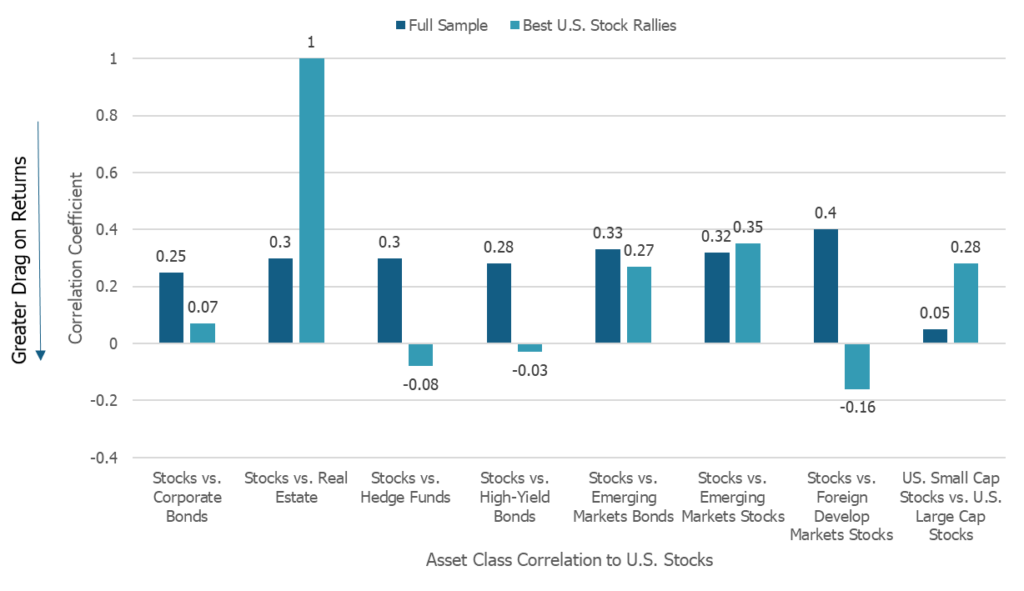
Data Source: Sebastein Page and Robert A. Panariello (2018). When Diversification Fails. Retrieved from https://www.tandfonline.com/doi/suppl/10.2469/faj.v74.n3.3/suppl_file/ufaj_a_12043535_sm0001.pdf
Again, the dark blue bars represent the full sample correlations and the light blue represent the correlations during the top 1% U.S. stock market rallies. When correlations decrease, that means the asset classes do not move as closely to U.S. stocks as they usually would and therefore the returns will likely lag when U.S. markets are rising sharply.
We can see in the chart that the changes in correlations during rising U.S. markets are not as severe as they are in down markets, but some asset classes like developed market stocks go from a fairly strong positive correlation with U.S. stocks to a negative correlation. This can have a severe drag on portfolio performance as potentially negative returns from developed market stocks will offset U.S. stock market gains.
Risk Management Beyond Conventional Diversification
It is important to note, the limitations of conventional diversification are not so great that it should be done away with all together in portfolios, after all, during normal markets the theory more or less works and can lower the volatility of portfolios and add value. However, during periods of uncommonly large gains or losses in the U.S. stock market, conventional diversification is likely to fail when portfolios least need it or need it most, resulting in less efficient portfolios and potentially lower long-term returns.
More sophisticated risk management techniques can be added to an investment portfolio to mitigate the negative impacts of conventional diversification failure. We will explore these risk management solutions in detail next quarter.
References
Sebastien Page and Robert A. Panariello. 2018. “When Diversification Fails.” https://www.tandfonline.com/doi/ref/10.2469/faj.v74.n3.3?scroll=top
