
Note: If you would prefer the audio version of Investing Insights, click here to listen to our podcast Episode 2: Trend Following – The Trend Is Your Friend
I know this is not a fashion blog, we are here to talk about investing. But have you ever thought about what influences your fashion decisions? This has never happened to me, but many people look back at old pictures and laugh at the clothes they were wearing. They may wonder…why is it I used to wear pants that dramatically flare out at the bottom making me appear to hover when standing? Or, why do I look like I am wearing football shoulder pads underneath my suit jacket? No one wants to be thought of as a follower, but that is probably the reason for our questionable fashion choices of the past…everyone else was wearing the same thing. In your defense, you probably wore it better than anybody else.
Humans are pack animals, we are tribal beings. Mob psychology, or the innate drive to follow the crowd influences not only our fashion decisions but also our investment decisions. Our tendency to follow the pack has been key to our evolutionary success. Humans are small and weak compared to top predators and we have minimal natural physical defenses. We have learned that we can be far more successful as a group than as individuals. Beyond forming tight family and community groups, obviously our intellect relative to the rest of the animal kingdom also sets us apart. Our great intellect makes us smart enough to realize evolution has ingrained behaviors in us that are detrimental to the modern demands of sound investment decision making, yet we are still powerless to override our instinctual behavioral biases. Unfortunately for investors, instinct usually wins out over smarts. Despite our self-awareness, we cannot prevent ourselves from being influenced by mob psychology when faced with the powerful emotions of fear and greed that come with making investment decisions…even when we know we are being negatively influenced.
While the impact of mob psychology is the source of most investors’ losses and biggest investment failures, for the well-informed, disciplined investor, mob psychology is a fantastic and robust source of superior, long-term investment returns. To profit from mob psychology we only need the correct investment approach that is designed to remove ourselves from the routine investment decisions we are so bad at making. We can then profit from our own behavioral biases and at the same time dramatically reduce our investment risk!
How to profit from mob psychology
Empirical evidence presents a solid case that financial markets are mean reverting in the way prices move over time. There is no way to definitively prove this, but I believe the market tendency toward mean reversion is driven by human psychology. The market is after all a human construct and humans are the primary participants in the markets that we create. Humans are highly irrational when fear or greed lead us to follow the crowd, our irrational behavior make financial markets impossible to predict. However, what can predict is the certainty market participants will succumb to the mob psychology that is the driving force of the boom and bust cycles we see repeat over-and-over again in financial markets.
The way to profit from the predictability of human psychology is to make investment decisions using what are called quantitative investment strategies instead of depending on human discretion, which is highly corruptible regardless of investor experience. Quantitative investment strategies seek to eliminate human discretionary decision making from the investment process, because simply put, humans suffer from behavioral patterns and biases which make us all uniquely bad at making consistently good investment decisions. The creation of quantitative investment strategies is an acknowledgment that simply understanding our behavioral biases is not enough to prevent us from allowing them to distort our judgement. Quantitative investment strategies are designed to capitalize on market movements driven by predictable investor behavior by forcing systematic, consistent and emotionless investment decisions.
Trend following is a type of quantitative investment strategy that seeks to systematically profit from mob psychology by identifying trends in price movement, up or down, and then investing with the trend until the trend reverses. Trend following is really an extremely simple concept, identify and buy securities that have performed well in the recent past because they are likely to continue to perform well for some time into the future. Trend following is a form of momentum investing in that when the price of a security is in motion in one direction the price tends to remain in motion in that same direction. What drives price momentum is human psychology, particularly the human tendency to follow the crowd of similarly flawed humans. For example, when one stock is outperforming most other stocks, investor greed lures investors to buy the outperforming stock with the hope of making outsized profits. When investors pile into the same trade on a large scale, the result is significant upward price momentum that is completely detached from the fundamentals of the individual company that the investor is investing in. The objective of trend following strategies is to identify when this is happening and to join the trend or the crowd. But as soon as signs appear that price momentum is slowing or reversing direction to quickly cut losses.
The mechanics of trend following
There are two primary methods to evaluate the price momentum of a security. The first is called relative momentum, which involves comparing how a single security’s price is moving relative to any number of other securities. The goal is to find and invest in the securities with the strongest upward price momentum, because securities with strong upward price momentum are likely to continue to appreciate for some period-of-time into the future. The second method for evaluating momentum is called absolute momentum, which is the process of comparing the price momentum of an individual security to itself. For example, over the past year has the price been going up or down on average? It is possible to use both relative and absolute momentum in a single trend following strategy or to simply use just one of the methods.
Both relative and absolute momentum strategies generally evaluate price momentum using 50 to 200 day moving average price calculations excluding the previous month. Other indicators besides moving average prices can be used in trend following strategies to identify the direction of the trend or what securities will be purchased when the trend is favorable. Some trend following strategies simultaneously invest in securities with the highest upward price momentum and short the securities with the highest negative price momentum. 3Summit does not use short positions in our trend following strategies. Our research indicates that transaction and margin costs have a significant negative impact on returns and also long/short trend following strategies are dramatically riskier because they are prone to sharp momentum reversals. During my decade of designing trend following strategies, I have found that keeping the strategies simple and limiting the variables used to assess the magnitude and direction of price momentum is the key to improving the results and efficiency of any trend following strategy.
Why we believe trend following will continue to work?
3Summit’s trend following strategies have historically proven very successful, but we carefully evaluate our strategies to assess whether we believe it is probable they will continue to work going forward as markets continuously change. We test to see how robust the strategy has been historically by looking at how the investment strategy performed across many unrelated asset classes and markets. When a strategy performs well across unrelated asset classes like stocks, bonds, currencies, and commodities and across geographies like domestic and international markets, we consider the strategy to be robust and therefore likely to continue to perform well into the future. When a quantitative strategy can effectively perform in all markets it demonstrates that the investment opportunity still exists and that the strategy is designed properly to capture returns from the market inefficiency created by behavioral bias.
Well-designed trend following strategies routinely demonstrate that they are extremely robust across all asset classes and markets. In fact, the trend following strategies we design and manage for our clients are the most robust strategies of all the strategies we implement. Keeping in mind that historical results may not be indicative of future outcomes, and that the future is unknowable, investing in strategies that show consistent historical performance across asset classes and geographies we believe indicates a high probability that the investment opportunity will persist into the future.
Why does 3Summit use trend following strategies?
We have discussed the mechanics of how trend following works and established that trend following has historically been a very robust strategy, meaning the probability that the opportunity to profit from the strategy into the future is high. Let’s now explore how trend following can benefit a diversified portfolio. The best way to demonstrate the power of investing with the trend is to look at a hypothetical example. We will use a 3Summit trend following strategy called Global Tactical Trend (GTT) in this example. The data used has been back tested to 1972. An important reminder, this example is hypothetical, past performance is not a guarantee of future results.
The GTT strategy alternates between three different investment positions based on price momentum. The strategy is 100% invested in one of three markets at any given time, either international stocks, U.S. stocks or in cash and bonds. Where the strategy is invested depends on the relative price momentum between U.S. and international stocks and the absolute momentum of both the U.S. and international stock markets. Using the momentum indicators, the strategy is then invested 100% in the market with the most upward price momentum or it takes a defensive position in cash and bonds. The benchmark this strategy seeks to outperform with lower levels of risk is the MSCI World Index.
I use trend following strategies like GTT to accomplish 3 primary objectives within a diversified portfolio.
1. Generate higher long-term returns than the MSCI World index with lower levels of risk.
2. To use price momentum to tactically shift investment between domestic and international markets based on where the most favorable trend exists.
3. Finally, to reduce losses during dramatic market corrections and bear markets.
Now we can look at the back tested strategy to demonstrate how a strategy like GTT can accomplish each of the previously mentioned objectives. The first chart below compares what two $100 investments in both the GTT strategy and MSCI World Index in 1972 would be worth today.
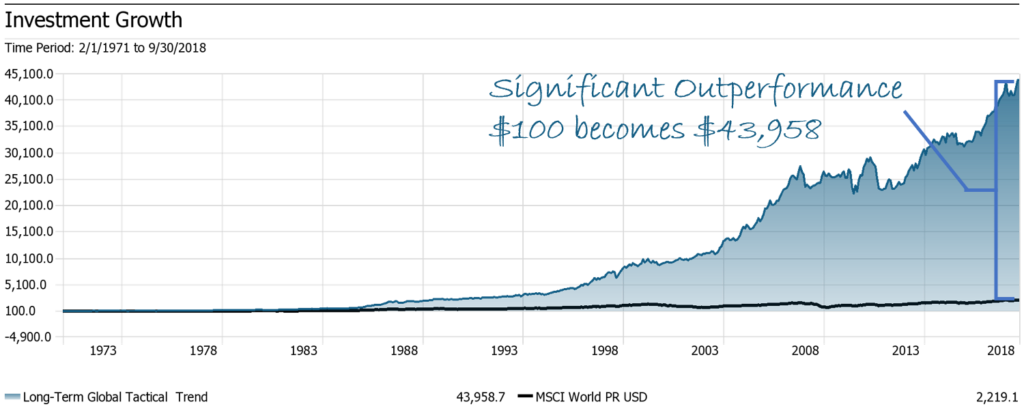
What is immediately evident from this chart is that the trend following approach of the GTT strategy resulted in significantly greater wealth creation over the time period. The $100 initial investment in the GTT strategy would be worth $43,958 dollars today versus just $2,219 for the $100 investment in the MSCI World Index. The next data table below shows the risk and return statistics for the two investments during the entire time period between 1972 and September 2018. The GTT had an average annual return of 13.62% compared to 6.53% for the MSCI World Index. Better yet, the GTT strategy accomplished these results with less volatility meaning less overall risk! These are great results.
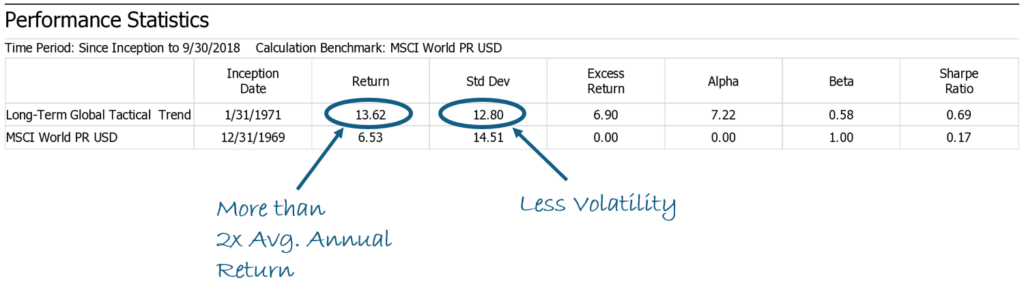
This hypothetical example demonstrates that the GTT strategy has historically been capable of achieving the first objective of generating higher long-term returns with lower volatility than the MSCI World Index.
There are two primary reasons the GTT trend strategy generated such positive results. The first reason is the strategy successfully achieved the second objective of shifting investments between U.S. and international markets with the goal of concentrating investments in the market with the highest upward price momentum. This strategic investment positioning over time resulted in significant excess returns versus the MSCI World Index. The second reason GTT performed so well is the strategy successfully accomplished the third objective of reducing losses during significant market corrections and bear markets. The final chart below shows the losses that both investments experienced during the time period between 1972 and 2018.
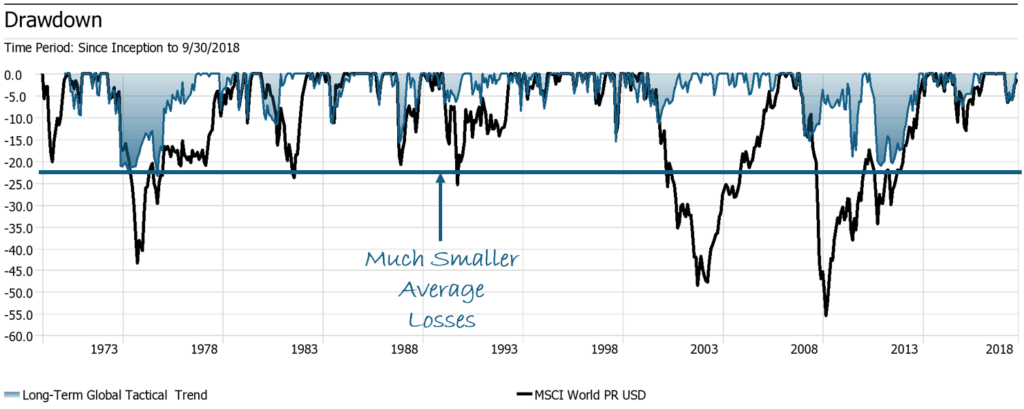
The chart shows the GTT strategy in almost all cases generated much smaller losses, particularly during very large market drawdowns.
I am sure you have heard me talk about this before, but it is not possible to over-emphasize how important it is that strategies and portfolios limit the size of losses. Large losses have a disproportional impact on a portfolio’s long-term returns because of the exponential relationship between the size of the loss and the returns required to recover from that loss. The MSCI World Index’s largest loss over the period was -55.37%, which required a return over 100% to just get back to even. The GTT strategy had a maximum loss of -23.44% requiring a much more modest return of around 33% to get back to even. This trend following strategy demonstrates an ability to dramatically reduce the size of losses and therefore it accumulates wealth much more efficiently than simply investing in an index.
How does 3Summit use trend following strategies?
Given the results of the example we just discussed, a logical question that many clients ask is why would I not invest 100% of my portfolio in 3Summit trend following strategies when they have historically been capable of such significant outperformance with lower levels of risk than simply investing in a diverse portfolio of individual stocks or in a market index fund? For investors who are deciding between a 100% allocation to stocks, I would recommend that they do invest 100% of their portfolio in trend following. However, trend following does not come without difficulties.
Most investors are constantly comparing their portfolios to the S&P 500 or some other market index, usually not intentionally. For example, an investor may be watching the news one day and a report comes on about how the stock market has gone up 25% for the year. They then check their trend following portfolio and it shows it is only up 10% over the same time period. The reason returns between a trend following portfolio and market indexes can vary so greatly is because the portfolio can enter and exit the market and is concentrated in different markets at different times depending on price momentum. Trend following portfolios can dramatically lag the market at times or be outperforming at times. The short-term results of a trend following strategy can differ greatly from that of a market index because trend following portfolios have a investment characteristic called high tracking error. This means that they do not act like a stock portfolio or index fund that tend to follow very closely to the market index. For an investor who tracks their portfolio regularly in relationship to market indexes, trend following strategies can be frustrating and difficult to remain committed to when evaluating using short time frames. The very reasons that trend following can be so successful over long periods of time are the same reason they can be hard to stick with during the daily drama of markets. It is not easy to watch the stock markets go up and for your trend following strategy to be in bonds, or to watch the stock market go down and for your trend following strategy to be fully invested in the stock market. However, both scenarios happen frequently, however on average a successful trend following strategy over a long period of time will be right more often than wrong and the wins will be bigger than the losses.
It is important to understand that trend following is not market prediction. Because trend following strategies look backwards to identify pricing trends, the strategies will never enter the market at the very bottom or exit at the very top. They are designed to capture the middle of a market move, which is where the majority of investment gains are made, so this is not a negative. Investors that are successful at trend following have a high conviction in the mechanics of the strategy and are able to trust the system while remaining focused on long-term results. Trusting the system is imperative to success in trend following because one of the biggest mistakes a trend follower can make it to override their own system. Keep in mind, the super power that quantitative investment strategies, like trend following, give investors is a system of avoiding discretionary decisions and falling prey to their own behavioral biases. It can be difficult to let the system work when the market corrects 10% quickly and the trend following strategy is still in the market. However, failure is assured if an investor overrides their own system, because they will have eliminated their investing edge and are now following the crowd based on emotional decision making.
At this point we can conclude that investing 100% of your portfolio in trend following strategies is a valid investment approach for very aggressive investors, however this is obviously not how 3Summit implements the strategies for the majority of our clients. Instead we use trend following as an essential component of a well-designed, multi-dimensionally diversified portfolio. Trend following adds many benefits to a diversified portfolio besides being a fantastic source of potentially significant long-term excess returns. Trend following strategies also add diversification benefits because they have low correlations to other stock strategies, but also, they add a unique source of returns that contribute in helping a diversified portfolio produce more consistent returns over time. 3Summit uses our expertise in trend following strategies to seek enhanced returns, protect portfolios from large losses during significant corrections and bear markets, to insulate portfolios from behavioral bias by removing human discretionary decision-making and to strategically shift a portfolios exposure between domestic and international stock markets.
There are not any other strategies that I am aware of with a similar potential as trend following to provide such a diverse list of benefits to a portfolio. Trend following is a time-tested investment strategy that has many forms and functions. There are many indications that trend following concepts have been used for more than a century by some of history’s most famous traders. Advanced technology and the ability to process large volumes of data quickly have dramatically aided in the speed and effectiveness in which modern trend following strategies can be implemented. Trend following strategies provide a systematic approach to cutting your losses short and letting your winner run.
*Model Portfolio DisclosureHypothetical Portfolio Analysis Disclosures – This analysis is designed to be a hypothetical view of how specific asset class allocations would have performed in the past. The portfolios represented do not represent live traded or managed portfolios. The data presented is for educational purposes only and is not investment advice. Historical data may not be accurate. The asset classes are represented by mutual funds, indexes and research datasets. The proxy data used for asset class returns cannot be directly invested in or traded. The 3Summit Portfolio is represented net of a 1% annual management fee.
Backtested Performance Disclosure Statements – 3Summit Investment Management is a registered investment adviser. Information presented herein is for educational purposes only and does not intend to make an offer or solicitation for the sale or purchase of any specific securities, investments, or investment strategies. Investments involve risk and unless otherwise stated, are not guaranteed.
The performance indicated for the model portfolios is back-tested. Back-tested performance is NOT an indicator of future actual results. There are limitations inherent in hypothetical results particularly that the performance results do not represent the results of actual trading using client assets, but were achieved by means of retroactive application of a back-tested model that was designed with the benefit of hindsight. The results reflect performance of a strategy not historically offered to investors and do NOT represent returns that any investor actually achieved. Back-tested results are calculated by the retroactive application of a model constructed on the basis of historical data and based on assumptions integral to the model which may or may not be testable and are subject to losses.
Back-tested performance is developed with the benefit of hindsight and has inherent limitations.
Specifically, back-tested results do not reflect actual trading, or the effect of material economic and market factors on the decision making process, or the skill of the adviser. Since trades have not actually been executed, results may have under- or over-compensated for the impact, if any, of certain market factors, such as lack of liquidity, and may not reflect the impact that certain economic or market factors may have had on the decision-making process. Further, back-testing allows the security selection methodology to be adjusted until past returns are maximized. Actual performance may differ significantly from back-tested performance.
Model Performance Disclosures – 3Summit Investment Management is a registered investment adviser. Information presented herein is for educational purposes only and does not intend to make an offer or solicitation for the sale or purchase of any specific securities, investments, or investment strategies. Investments involve risk and unless otherwise stated, are not guaranteed.
Readers of the information contained on this handout, should be aware that any action taken by the viewer/reader based on this information is taken at their own risk. This information does not address individual situations and should not be construed or viewed as any typed of individual or group recommendation. Be sure to first consult with a qualified financial adviser, tax professional, and/or legal counsel before implementing any securities, investments, or investment strategies discussed.
The performance shown represents only the results of 3Summit Investment Management’s model portfolios for the relevant time period and do not represent the results of actual trading of investor assets. Model portfolio performance is the result of the application of the 3Summit Investment Management’s proprietary investment process. Model performance has inherent limitations. The results are theoretical and do not reflect any investor’s actual experience with owning, trading or managing an actual investment account. Thus, the performance shown does not reflect the impact that material economic and market factors had or might have had on decision making if actual investor money had been managed.
Model portfolio performance is shown net of the model advisory fee of 1.00% the highest fee charged by 3Summit Investment Management and sample trading costs based on our Custodian Interactive Brokers’ trading costs. Performance does not reflect the deduction of other fees or expenses, including but not limited to brokerage fees, custodial fees and fees and expenses charged by mutual funds and other investment companies. Performance results shown include the reinvestment of dividends and interest on cash balances where applicable. The data used to calculate the model performance was obtained from sources deemed reliable and then organized and presented by 3Summit Investment Management.
The performance calculations have not been audited by any third party. Actual performance of client portfolios may differ materially due to the timing related to additional client deposits or withdrawals and the actual deployment and investment of a client portfolio, the reinvestment of dividends, the length of time various positions are held, the client’s objectives and restrictions, and fees and expenses incurred by any specific individual portfolio.
Benchmarks: The Hypothetical 3Summit Low Risk Portfolio performance results are compared to the performance of a blended benchmark. The blended benchmark consists of a 60% allocation to the MSCI ACWI NR with dividends reinvested and a 40% allocation to the Barclays Global Aggregate Bond Index with continuously reinvested coupon payments.
Return Comparison: The MSCI ACWI NR represents the world stock market including emerging markets and was chosen as a good representation of global stock market exposure. The Barclays Global Aggregate Bond Index represents the world total bond market and was chosen as a good representation of global bond exposure.
The results do not represent actual trading and actual results may significantly differ from the theoretical results presented. Past performance is not indicative of future performance.
3Summit Investment Management, LLC is a registered investment adviser. Investing involves risk, including the loss of principal. Investments will not always be profitable, and we do not provide any guarantees. Security prices and market conditions may change unpredictably and rapidly, diversification does not eliminate the risk of loss. Past performance is no guarantee of future results.
