
Click Here if you prefer the audio version.
Subscribe on iTunes
Investors have been surfing the epic wave of a record market recovery from the deep market bottom earlier this year. Since the lows in late March, the S&P 500 has generated cumulative returns of 43.38% as of the end of October!
Not only has the S&P 500 earned back the losses, which exceeded -31% from the first quarter of 2020, but the market also achieved new record highs in August. The recovery rally has been a welcome relief from what most people would probably agree has thus far been a generally terrible year.
It is 2020 so there must be more to the markets than new record highs and positive year-to-date-returns. There is…markets this year have not been normal, economic conditions in the U.S. and around the world are not good. We believe investment risk is very elevated at the present time, which you can read about in 3Summit’s last market commentary. In our last market commentary, the focus was on economic risk, in this quarter’s Investing Insights, I am going to focus on an emerging source of investment risk that has been sneaking up on investors with little notice.
Something is wrong with the S&P 500
The S&P 500 is the most common proxy for the broad stock market in the United States, investors, policy makers and business leaders all follow the index as a general measure of the real economy and the stock market. Throughout 2019 and accelerating this year, the S&P 500 has been building an imbalance that has become so pronounced the index has diverted from the underlying stock market and is therefore not currently a good proxy for the U.S. stock market.
The S&P 500 index is designed to select a sample of stocks that represent the broad market performance for U.S. large cap stocks. For a stock to be included in the index, a company must meet certain financial, fundamental and governance requirements. Once a sample of acceptable stocks has been identified for inclusion in the index, each stock is then assigned a weighting representing the proportion it will make up of the total index portfolio.
For the S&P 500 to be successful in its objective to be a proxy for the total market of large capitalization stocks, each stock’s weight in the index must accurately represent its impact on the total market. This is done by weighting each stock by its market capitalization (market cap). Market cap weighting makes sense because the larger a company is, the greater the influence the company would theoretically have on the performance of the broader stock market and therefore requires a larger weighting in the index.
The risk of market cap weighting is that the index can become very imbalanced when a small number of companies rise in value much faster than most of the other index constituents. Market cap weighting does not take into account if a company’s value is justified, the methodology simply assumes that higher value companies are more influential in the economy and therefore should be assigned larger weights in the index.
If the imbalance between the market capitalization of a small concentration of companies becomes excessive relative to the rest of the stocks in the index, this very small concentration of stocks can begin to dominate the index and dilute the performance impact of rest of the index constituents. When this happens, risk to investors becomes elevated and the index no longer accurately represent the underlying market.
The chart below shows the concentration of the S&P 500 in the five highest weighted stocks overtime going back to 1979.
Historical
Concentration of Top 5 Stocks
(S&P 500 3/31/1979 – 9/30/2020)
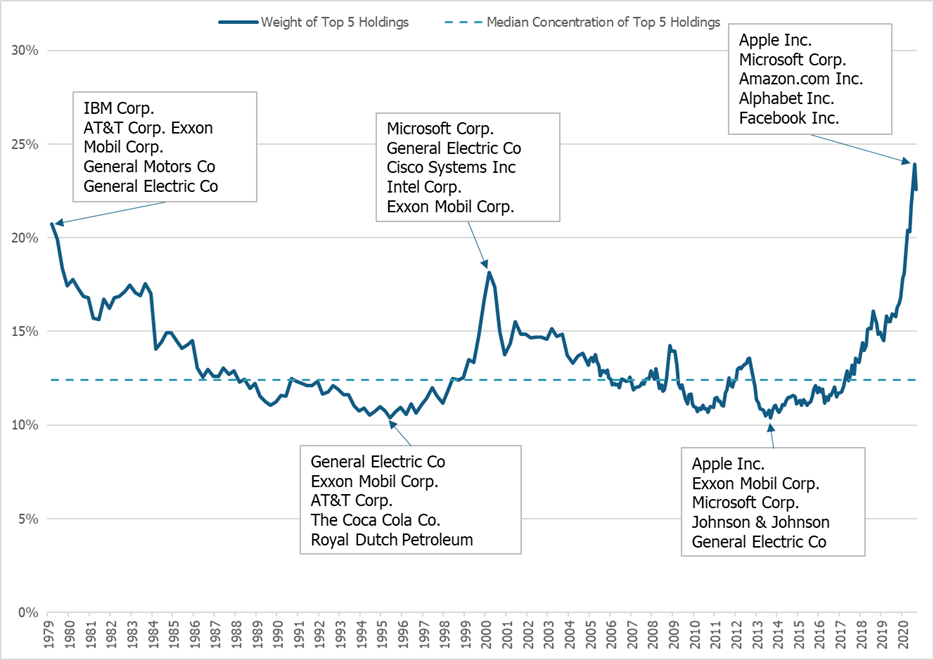
A few things jump out immediately in this chart. The first is that as of the end of September, the top five index holdings make up 23% of the total S&P 500 index, this is a record over the period we analyzed. The median concentration of the top five stocks is 12%, meaning the index is currently nearly twice as concentrated as normal.
Extreme stock concentration is not the only form of risk that can arise in market cap weighted indexes, usually when stock concentration becomes extreme so does sector concentration. Again, the chart above shows we are in uncharted territory, all five of the top stocks are technology related companies. Currently the top five stocks ordered from highest to lowest weight are Apple, Microsoft, Amazon, Alphabet (Google) and Facebook. These are all technology related companies, despite not all of them being classified as tech companies in the S&P 500 index. What is hard to argue against is that these companies trade like tech stocks, have technology platforms, and have tech like valuations. In 2000 the index reached historically high levels of concentration in the top five stocks driven by overvalued tech companies, yet only three of the top five stocks were technology companies in 2000, today all five are technology related companies.
The chart below highlights the extreme sector concentrations in the time periods corresponding to the three periods of extreme stock concentration in the chart we reviewed previously.
Sector Allocation
of the S&P 500
(March 1979 – September
2020)
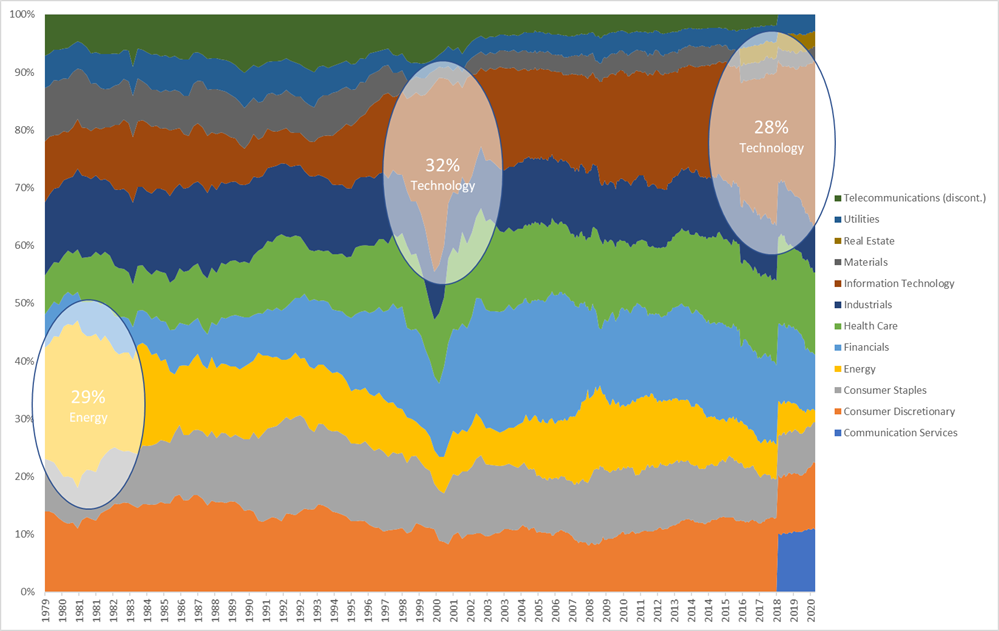
We can see that in 1979 stock concentration was extreme as was the weighting of the energy sector. In both 2000 and today, we have extreme stock concentration in the technology sector, moreover, we have almost reached the same concentration in tech that was present during the tech bubble. If you add Amazon, Google, and Facebook to the technology sector, which is a more appropriate classification, then we are far above the sector concentration in tech than 2000. This fact might be considered an ominous parallel. Of course, our economy has changed and is more services oriented, so a higher allocation to tech is not surprising, but we may be at the threshold of another growing tech bubble.
Finally, we can quantify how divergent the S&P 500 has become from the broader large cap stock market by evaluating the breadth of returns year-to-date of the individual index constituents. The S&P 500 has returned 2.77% this year through October 31st, yet 52% of all the index constituents have not recovered from the losses in March and have negative returns year-to-date and 56% of index constituent have underperformed the total index return.
What becomes clear from the analysis thus far, is that the S&P 500 has reached these levels of extreme concentration in the top five stocks and the tech sector because of the almost bubble like explosion in the value of tech companies, particularly in the biggest tech related companies including Apple, Amazon, Microsoft, Facebook and Google. Just like in 2000, the S&P 500 does not represent the total market for large capitalization stocks as much as it is a concentrated bet in the largest tech companies and tech sector more broadly.
What does extreme concentration mean for investors?
Investors in U.S. stocks have been impacted this year by the extreme concentration of the S&P 500 primary by underperforming the market. Those investors not invested in just a single S&P 500 index fund or that are more diversified and not willing to concentrate at least 23% of their portfolio in just five stocks, have likely been suffering underperfomance relative to the index.
Below is a chart of the performance of the S&P 500 year-to-date versus all the large cap mutual funds tracked by Morningstar.
S&P 500 vs. All Large Cap Managers
(Year-to-Date Performance)
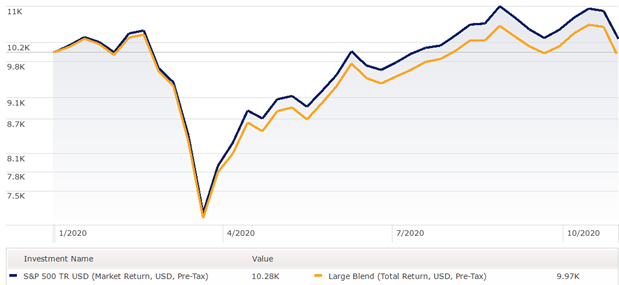
We find that beginning at the market bottom the average diversified large cap fund(orange line), has consistently fallen behind the market (blue line). This level of underperformance over such a short time period between the average large cap mutual fund and the S&P 500 index is rare but corresponds perfectly with the dramatic increase in the index concentration in the top stocks over the last six months.
To get a better idea of how widespread underperformance is among investors, lets dig down on the performance of all active large cap mutual funds. Underperformance among mutual funds is the norm and not the exception, however this year has been particularly painful for mutual funds.
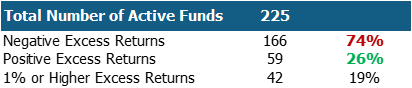
I found that of the 225 funds, 166 lagged the S&P 500 year-to-date as of September 30th, for a total of 74% of funds underperforming. I have presented the best case scenario in this analysis because I included only institutional share classes of the mutual funds, when running the same analysis on the higher fee retail share classes the number of funds that underperform is even higher.
It is not difficult to figure out why so many mutual funds underperformed, the majority of the funds where underweight to the top five stocks of the S&P 500, whereas the majority of outperforming funds where overweight the top five stocks. The top five stocks have generated astronomical returns this year of 40.07% versus just 2.77% for the S&P 500 index. It is hard to emphasize enough how huge of an impact the top five stocks have had on the performance of the S&P 500 year-to-date. The chart below demonstrates the point. When I exclude the top five stocks from the S&P 500, the index generated a return of -4.64% instead of its actual performance of 2.77%. Any investor with less than 23% allocated to the top five stocks has been hurt badly for sensible risk management and aversion to excess risk.
Year-to-Date Returns
(as of 10/31/2020)
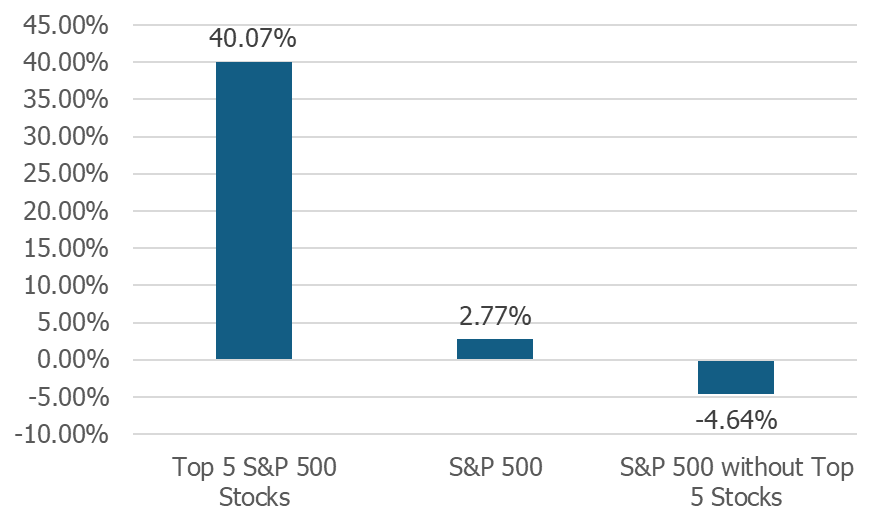
Before we move on, let us quickly break down the return numbers a bit further. The top five stocks in the S&P 500 contributed 6.25% to the total return of the S&P 500 year-to-date. Another way to state the significance of these top stocks contribution to the index is that they have generated 225% of the total return of the S&P 500 so far this year. Furthermore, the technology sector has generated year-to-date returns of 24.52% and contributed 4.89% to the total return of the index, or 176% of the total return.
To ensure to not double count, when I remove Apple and Microsoft from the technology sector return, I calculate that the top five stocks plus the remaining technology stocks contributed 7.59% to of the total 2.77% return of the S&P 500 so far this year. This is 274% of the total S&P 500 return, which demonstrates just how dominate these stocks and sectors have been in driving returns in the S&P 500.
Why extreme concentration matters
The extreme concentration within the S&P 500 matters and should not be ignored by investors. For one, investors who are invested in market cap weighted large cap index funds or actively managed mutual funds, may believe they are more diversified than they actually are and that their risk exposure is less than it is in reality. Only hyper vigilant and well researched investors are likely to notice the level of concentration creeping up in their portfolio. Concentration creep is such a risk because it is stealthy.
Most passive index investors in an S&P 500 index fund likely take comfort in the perceived diversification of their investment across over 500 individual stocks. However, when 23% of the index is in just five technology related stocks, those feeling of security are probably not justified.
For mutual fund investors it can be even worse. Mutual fund managers are under extreme pressure to outperform the market, their job security, and the amount of assets in their funds depend on their investment performance relative to the market. This pressure “forces” many managers to take greater risks than they might otherwise, or that their fund investors may know they are taking. To perform with or above the market when the S&P 500 is so concentrated requires the manager to either match the weights of the top stocks or even exceed the index weights. My analysis shows that the average mutual fund that is outperforming has an average weight of 24% in the top five stocks, that is serious portfolio concentration.
The bottom line is that many investors are not aware of the large single stock and sector bets they are currently making in their portfolio or the true extent of their downside risk.
A return to the mean
Investing offers few certainties, however one certainty every investor can count on is that markets will always change over time. Historically, periods of past extreme concentration in stocks and sectors within the S&P 500 have not lasted and concentration levels have demonstrated a nice mean reverting pattern. There is no reason to believe that the index will not return to median concentration levels or below.
Because of the mean reverting nature of stock and sector concentration, we can look at the past two periods when concentration reached a peak in 1979 and 2000 to get a better understanding of how the S&P 500 may return to normal this time around. The chart below shows the drawdowns of the S&P 500 since 1979 and the blue sections show the period between the peak of concentration and the return to median concentration levels.
S&P Drawdowns (Losses)
(March 1979 – October 2020)
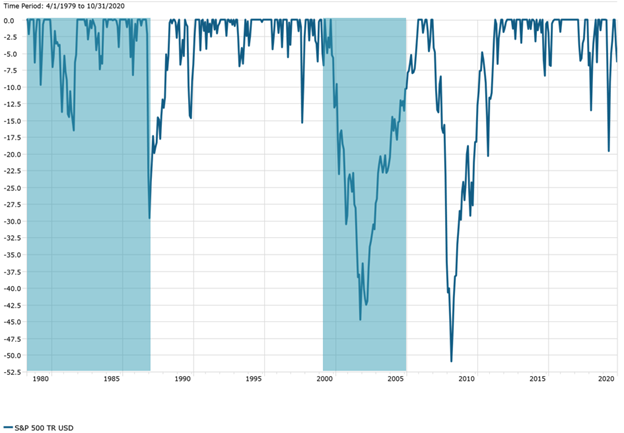
In both periods, a peak in concentration was followed by heightened market volatility and large drawdowns. Only one major drawdown did not occur following peak concentration and that is 2008 and the great recession. In 2008 the S&P 500 was at median concentration, but the shock to the economy was so great from a credit collapse and deleveraging that the market decline was broad based across individual stocks and sectors. What makes this observation interesting is that it could be argued that the sky-high valuations of individual sectors and stocks is what led to the large market corrections in both 1979 and 2000. Extreme concentration in the S&P 500 is an early sign of asset bubbles in sectors and individual stocks and in the past these bubbles have been catalysts for large losses.
In 1979 the energy sector was high-flying and extreme concentration in both the largest energy stocks and the sector was present. Energy stocks became very volatile, and because of their dominance in the index, so did the index. In late 1983 energy stocks corrected significantly and this created dramatic index losses, but also the resulting shrinking market capitalizations in energy brought the index into balance.
A similar story played out in 2000 with technology stocks. Shortly after peak concentration in technology caused by a protracted speculative frenzy, in 2000 the floor dropped out of tech stocks. The massive reduction in technology market capitalization naturally brought the index into balance again.
I just have one final point to make about the drawdown chart. Large losses usually followed about a year following peak concentration in the S&P 500, However, the process of the overvalued sectors declining in market cap in addition to more broad based performance within the other sectors can take five or more years.
It is easy to draw conclusions from this analysis, but caution should be taken as history can be a guide but markets rarely repeat history exactly. What is clear is that this is an exceptional moment in the markets given the historically high single stock and sector concentration in technology.
What should investors do?
Finally, I want to wrap up our discussion with some strategies for managing risk in this time of extreme concentration in large cap stocks. First, understand that imbalances can last much longer and get more extreme than you could ever imagine and then the reversion to the mean can take half a decade or more. I have written about this before, but navigating these types of markets is when the most important investing skill, patience, becomes imperative.
The best advice I can give is to always invest looking ahead and not behind. Jumping on the big wave late by overweighting the hot stocks after a 40% gain is bound to not end well. Long-term investors must decide whether they are going to try to jump on this monster wave in tech late or look to catch the next big wave. No choice in investing is easy, catching a wave late means you will likely experience maximum pain when the wave suddenly breaks. Alternatively, catching a wave early requires patience and a willingness to underperform for potentially years.
You must also consider risk. If you are comfortable with the risk of investing 60% of your assets in a diversified stock portfolio, given the concentration of the S&P 500 currently, that allocation is probably as risky as if you were invested 70% in stocks in more normal markets. If you are close to retirement, reducing risk in this environment is probably prudent, it is better to give up some short-term returns to avoid the devastation of a very large loss late in your time horizon.
For longer-term investors that want to use this as an opportunity to make a tactical trade, it makes sense to underweight the technology sector and overweight financials and energy. If you go back and review the Sector allocation chart above, you will see that energy could be a once in 40-year opportunity currently. Energy has been reduced to just a 2% weighting as the sector has taken a beating. These are just minor portfolio tilts that might be the next big wave if you have the patience to wait for it.
Finally, you can add trend following to your portfolio and invest in non-market cap weighted indexes. Many indexes weight by revenue, risk and many more fundamentals. I believe strongly in diversifying across different weighting strategies and adding tactical strategies, particularly in a market like we are in currently.
Regardless of the strategy you use to manage risk in these markets, remember that you must be willing to underperform to have the chance to outperform over the long-term. Chasing returns is almost always a fool’s errand and can be very damaging to your long-term investing success. The ability to see long-term opportunities and have the wisdom to exercise the patience to ignore short-term underperformance is what separates the best investors from everyone else.
