
Click Here if you prefer the audio version.
Subscribe on iTunes
Stock valuations have only been higher one other time since 1870. The highest valuations in history were achieved in 2000, the year the stock market peaked and crashed as a result of the massive tech bubble bursting. Market valuations approaching a new record high is a foreboding indicator to be sure, especially given their mean reverting nature.
Investors are facing economic conditions that have not been seen for 40 years. This quarter, we will examine how to measure and evaluate stock market valuations and then identify the driving economic forces responsible for their rise to such significant levels. Finally, we will discuss the economic mechanisms that pull valuations back towards their mean, what indicators investors should be monitoring and what those indicators may foreshadow for stock prices and valuations going forward.
Despite historically high stock valuations, there may still be plenty of room for valuations to move higher, high valuations do not indicate immediate doom for investors. Valuations are not predictive of future market direction on their own, by gaining insights into the economic forces behind stock market valuations we seek to better understand what investors should be monitoring in today’s markets and provide a solid foundation for forward looking investment planning.
Frothy Markets in Historical Context
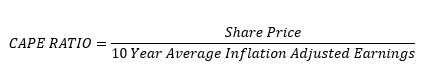
One of the most useful measures to gauge stock market valuations is the Shiller CAPE ratio. The CAPE ratio is simply the share price of stocks divided by 10-year average inflation adjusted earnings.
When applied to an index like the S&P 500, the CAPE ratio tells us how many times average long-term earnings investors are willing to pay for stocks. For example, a CAPE ratio of 16 means investors are willing to pay 16 times average earnings to own stocks. A CAPE ratio calculated for just one date gives us little information about how expensive or inexpensive a given stock market is in isolation. The current CAPE ratio is most powerful as a relative measure and therefore becomes useful when compared to historical CAPE ratios because we can compare current stock price to earnings multiples to the historic average or to past periods in stock market history. Relative comparisons put current stock market valuations into historical context, which is essential in evaluating how expensive or cheap stocks are relative to history.
Currently, the CAPE ratio is reading 37.3 and the chart below puts the current CAPE ratio into historical context going back to 1870.
Nothing to See
Here
Shiller Cape Ratio (1870 – 2021)
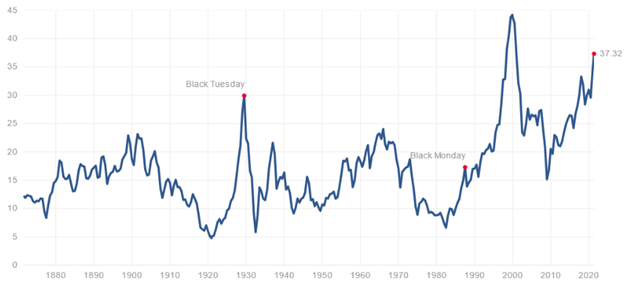
The CAPE ratio is currently more than twice the historical average CAPE ratio of 16.8. Looking at the chart we can see that only during the tech bubble in 2000 have investors been willing to pay more for long-term average earnings. Should investors be concerned? Probably. But different economic environments can support different valuation levels, the economy does not follow consistent rules and records are made to be broken. Historically, high valuations on their own are not useful in making investment decisions but evaluating the economic environment through the components of the CAPE ratio is very useful when factoring in macroeconomic considerations to forward looking investment decisions.
First, it is logical that we understand the CAPE ratio equation prior to using it as a lens to evaluate the economic environment, starting with the denominator (average long-term corporate earnings). The CAPE ratio is a great valuation metric because of its stability, which is derived from the denominator because the calculation minimizes business cycle bias. Business cycle bias is minimized through the smoothing of highly variable corporate earnings by averaging quarterly inflation adjusted earnings over ten years. Averaging ten years of earnings makes sense because the logic fits economic reality. A full market cycle from one recession to the next takes about ten years in today’s economy and corporate earnings swing up and down with the business cycle. Looking back at just the previous year of earnings or smoothing over too short of a time period, biases the calculated valuation based on where in the business cycle the economy is at the time.
The numerator of the CAPE ration equation requires no explanation, it is simply the current price of stocks. Valuations expressed by the CAPE ratio are much more sensitive to current stock price changes than to corporate earnings, which is good because the ratio better reflects the reality of how the real economy works. Corporate earnings in the denominator, are averaged over ten years, so changes in current earning only modestly impact the denominator and therefore changes in the CAPE ratio.
While earnings are variable and often corelated to the business cycle, over longer periods earnings are much more stable than prices. Current stock prices in the numerator are highly variable and not smoothed through averaging, this means the impact of current price changes greatly influences valuations as expressed by the CAPE ratio. Prices almost always change before earnings because investors are forward looking and adjust how much they are willing to pay to own stocks based on their expectations for the direction and magnitude of change in earnings. To round out the review of the CAPE ratio it is crucial to understand how valuations are useful to investors and where to use caution.
This is important, the CAPE ratio is not a crystal ball. In fact, it has historically been a horrible predictor of market direction and should not be used to try to time the markets. Extreme valuations both high and low can become more extreme and persist for longer than you can imagine, empirical analysis shows that stock valuations are not predictive of market direction over any timeframe.
What good then, is looking at market valuations if they do not inform us on the future direction of the stock market? Valuations are a fantastic tool for identifying the macroeconomic drivers of valuations, if you understand the drivers then you can make higher probability estimates of when and how the economy might reach a turning point. Understanding the drivers of valuation is still not a crystal ball, but it is a framework for making better investment decisions and facilitates a deeper understanding of the current market environment.
How Valuations Have Reached Such High Levels?
Through the lens of the CAPE ratio, we can examine what has driven valuations to these historically elevated levels. Since the Financial Crisis of 2008 and 2009, we have seen the stock market rise relentlessly, fueled by Federal Reserve (Fed) policies designed to support asset prices.
Fed policies since the Financial Crisis have been laser focused on driving growth in the numerator of the CAPE ratio. Meanwhile, anemic growth has persisted since the Financial Crisis with real economic growth averaging around 2.3% as measured by Gross Domestic Product (GDP). The slow economic growth has produced only modest earnings growth; therefore, we have seen the numerator or the price of stocks in the CAPE ratio grow much faster than the denominator or earnings resulting in rising valuations.

During the Financial Crisis, the Fed expanded the tools at their disposal to manage interest rates and keep them unnaturally low to shepherd the economy through the crisis by introducing Quantitative Easing (QE). Interest rates were near the zero bound in 2009, but high unemployment persisted, QE was then introduced to help lower interest rates along the entire yield curve through large government bond purchases by the Fed with the goal of supporting/lifting asset prices. QE lifts asset prices by bringing down the cost of capital for businesses to operate and expand while also increasing the demand for stocks by forcing investors to take more risk to earn acceptable returns. QE is the printing of money to buy government bonds thereby holding down interest rates far below their natural levels because the Fed steps into buy low yielding bonds when there is not adequate demand in the markets for them. QE proved to not be materially inflationary because only small amounts of the printed money used by the Fed to buy bonds actually found its way into the real economy.
The problem with QE comes when trying to reduce the bond buying without crashing asset prices. Over the last 13 years, whenever investors expected the Fed to back away from bond purchases and normalize interest rates, fits of declines in stock prices ensued. The Fed became boxed into maintaining unnaturally low interest rates and continued forcing investors into risk assets like stocks to maintain low unemployment. Extremely accommodative Fed policy over this extended period resulted in large inflows of capital to stocks, all of which is chasing a limited number of shares, combined with modest earnings growth.
In early 2020 the markets were grappling with the expectation the Fed would begin normalizing interest rates after 12 years, then the pandemic struck. As usual, and appropriately, the Fed stepped in massively to support asset prices. This time, the Fed launched QE programs that were orders of magnitude larger in dollar terms than during the financial crisis. The Fed intervention combined with massive fiscal stimulus packages not only prevented additional market losses but added fuel to the fire of rising stock market valuations.
To make a long story short, stock valuations have become the second richest in history thanks to massive and continuous monetary policy programs, specifically designed to support and grow asset prices. Fed policy produced an environment that has forcefully driven stock prices in the numerator of the CAPE ratio up much faster than the denominator resulting in rising valuations and a growing separation between the growth in stock valuations and GDP.
How Can Markets Return to More Sustainable Valuations?
There are two main ways high valuations can get pulled back towards their mean, they are a collapse in stock prices and inflation. Looking at price collapses first, this is the fastest and most dramatic form of devaluation. When prices collapse, the direction of corporate earnings in the denominator of the CAPE ratio is irrelevant because any change in earnings will minimally impact the long-term average earnings and therefore do not materially slow down sudden declines in valuations.

Price collapses become a lot more likely when asset bubbles exist because a single external catalyst can trigger rapid and devastating collapses in stock prices. Asset bubbles are not required to experience price collapses, just like high valuations are not required for the economy to suffer economic recessions or a severe bear market in stocks.
The more gradual, but still effective form of devaluation comes through persistently high inflation or the expectation of persistently high inflation. Stocks that produce large cashflows and have pricing power are a good hedge against moderate, transitory inflation because companies can usually raise prices to maintain their profit margins. However, persistent high inflation usually exceeds companies pricing power over time, which collapses profit margins and pulls down stock prices faster than earnings resulting in declining valuations.
The price of stocks in the numerator of the CAPE ratio declines when persistent inflation arises or when investors anticipate persistently high inflation in the future. High inflation causes profit margins of businesses to get crushed, and unprofitable business that rely on less expensive capital often fail to continue to fund operations. When inflation rears its head or even the expectation of inflation, investors immediately discount the multiple of earnings they are willing to pay for stocks, therefore causing stock prices to decline. The inflation triggered devaluation process has historically been more gradual and fluid than price collapses.

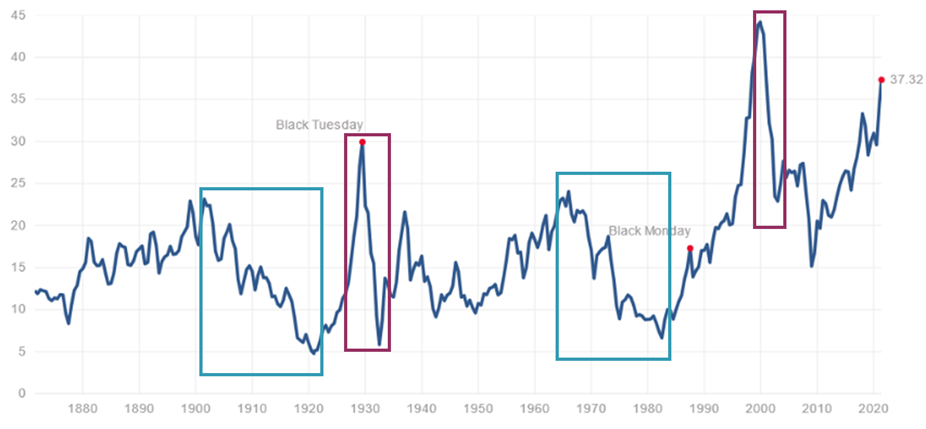
Revisiting the historical CAPE ratio in the chart below, the top four highest historical valuations and their subsequent devaluations are highlighted. The price collapse devaluations are highlighted in purple and the inflationary devaluations are highlighted in blue. The chart shows that price collapses are sudden and severe compared to inflationary devaluations that are more drawn out with a lot of valuation variability but with a strong down trend. Inflationary devaluations can last for decades compared to a few months or a few years for price collapses.
Historical Shiller
CAPE Ratio
(1870 – 2021)
What is going to pull valuations down this time?
All investors would love to know how much longer valuations are going to climb, when valuations will start to decline, and which devaluation process will ultimately drive devaluations. The kicker is that nobody can know the answers to these questions as there are just too many variables. But we can use what we have learned so far and again through the lens of the CAPE ratio, evaluate the current economic environment and deduce the highest probability future outcomes.
While we still grapple with the effects of the pandemic, the Fed has made it clear that their policy is to take out all the stops to support asset prices, especially while unemployment is still high. There are potentially asset bubbles in crypto currencies, luxury collectables, some pockets of the stock market and housing. However, there is every reason to believe that the Fed can and will step in to prevent significant price collapses, at least for the next 12 to 18 months. A price collapse is certainly a risk with such inflated valuations, but the current economic environment would make the probability of persistently high inflation or the expectation of persistently high inflation the most likely method of devaluation.
There are ample reasons to believe that inflation is the biggest risk to valuations given the current economic environment. First, inflation is already beginning to appear in the economy, just the expectation of inflation can threaten stock valuations. The inflation we are seeing could easily be transitory given the huge amount of fiscal stimulus in the economy, high levels of consumer savings and pent-up consumer demand that is just starting to be unleashed. There are also plenty of reasons to believe that high, persistent inflation is very possible within the next 12 to 18 months.
The pandemic has seen the Fed go from QE to full on debt monetization. The money supply just this year alone has increased by 30%! Earlier, I explained why QE has not been inflationary, despite the fact it involves printing money; however, debt monetization is a different beast. The federal government is running huge deficits, much of which is a result of unprecedented economic rescue spending programs by the federal government.
So far, through various programs the government has distributed almost $3 trillion over the last 12 months to support individuals, families, and businesses through the pandemic. Unlike QE, which is a bond buying program, the money distributed as part of the rescue packages goes directly into the real economy and impacts the money supply.
It works like this; congress passes legislation to deliver financial rescue programs for trillions of dollars the government does not have. The treasury then issues new treasury bonds to borrow money to pay for the programs but given the low interest rates offered on government debt and the massive quantity of bonds being sold into the market there just aren’t enough buyers for all the new bonds. To solve this problem, the Fed pushes a button and prints money out of thin air, then uses that money to buy half of the newly issued bonds that cannot find buyers. The proceeds of the sale of bonds goes into the treasury and then is given to people and businesses and flows directly into the economy.
The scale of debt monetization is enormous with more than 50% of government spending financed through debt, the Fed buys half the new debt with printed money. Debt monetization pared with a white-hot real economy and unnaturally low interest rates is the perfect recipe for high inflation and certainly not sustainable over long periods of time. Inflation is a clear risk threatening stock prices.
The best outcome for investors is also possible. If the real economy measured by GDP grows at significantly higher rates than 2.3% a year for a few years, it is possible that earnings will increase much faster than prices and that the inflation we face will prove transitory. If these events occur, we may sail smoothly out of this danger zone, have lower valuations and potentially see the Fed with a booming economy raise interest rates into inflation and normalize monetary policy.
When we evaluate the current economic environment through the lens of the CAPE ratio, we can easily see that investors should be monitoring inflation closely and any signs that it will not be transitory in nature. Late this year or early next near investors will likely have a better view of the Fed’s ability to maintain control over inflation. If inflation proves to be transitory, then investors will need to monitor how well stocks handle the pulling back of QE and debt monetization by spurring demand for treasuries through higher interest rates. If GDP is growing around twice it’s 12 year average rate, then stock prices might only be minimally impacted through tightening monetary policy because of the impact real economic growth will have on investors positive expectations of earnings growth going forward, resulting in more stable stock prices.
Diversification Is The Answer
What I hope is most clear to you at this point, is that insights gained through assessing the drivers of stock market valuations are far more useful than simply looking at stock market valuations in isolation. Stock market valuations are helpful in providing hints at investors willingness to buy stocks but are not actionable from an investment decision making perspective. We identified inflation and GDP growth as very important indicators of what investors might expect going forward from a stock valuation perspective.
From our analysis of stock market valuations, it is clear that predicting stock market direction depends on many variables given the current economic environment and any prediction would just be a guess. Given that stock valuations are historically high and there are many risk factors given the current economic conditions we can say confidently that there is likely more downside risk than upside potential for investors as we move through the next 12 to 18 months. It would not be prudent to pull your money out of the markets, but it is also not prudent to be 100% invested in the areas of the stock market that have seen spectacular gains over the last year and a half.
Risk management is key to investing all the time but is especially important given the current market environment. Investors should be positioning for rising bond yields, potential inflation, and the possibility of continued upward movement in stock prices. In other words, investors should be well diversified right now.
As markets have rallied, virtually without pause for 12 months straight, diversified investors have reach near peak dissatisfaction with their double digit returns last year, coinciding with excessive risk taking and exuberance among large numbers of market participants. These are all clear indicators of a frothy stock market. Risk management is always important, but more so now as uncertainty regarding future returns grows. While diversification underperforms on the way up it outperforms where it matters, on the way down. Limiting downside is key to preserving and growing wealth over the long-term and all investors would be wise not to indulge in the market exuberance with excessive risk taking.
